Thermal Comfort - It’s All in Our Head
But it’s also impacted by the social & physical environments. Part 4 of a series exploring the design implications of buildings as part of the human phenotype as well as our selective environment.

I initially set this series up by providing an overview of the built environment’s dual evolutionary nature as well as covering the concept of evolutionary mismatches. In this article digging deeper into the implications of all this I’m focusing on thermal comfort, covering some of the relevant physiological, psychological, and social factors.
When looking at thermal comfort, ethnography, and anthropology in general, can be useful for understanding a building population’s clothing choices as well as the nature of the activities being conducted within the facility’s various spaces. As the insulative properties of clothing and occupant metabolic rates resulting from activity levels are two of the key determinants of thermal comfort, understanding the contextual nuances involved with each is important for aligning the physical and social environment with evolutionarily shaped thermal comfort needs.
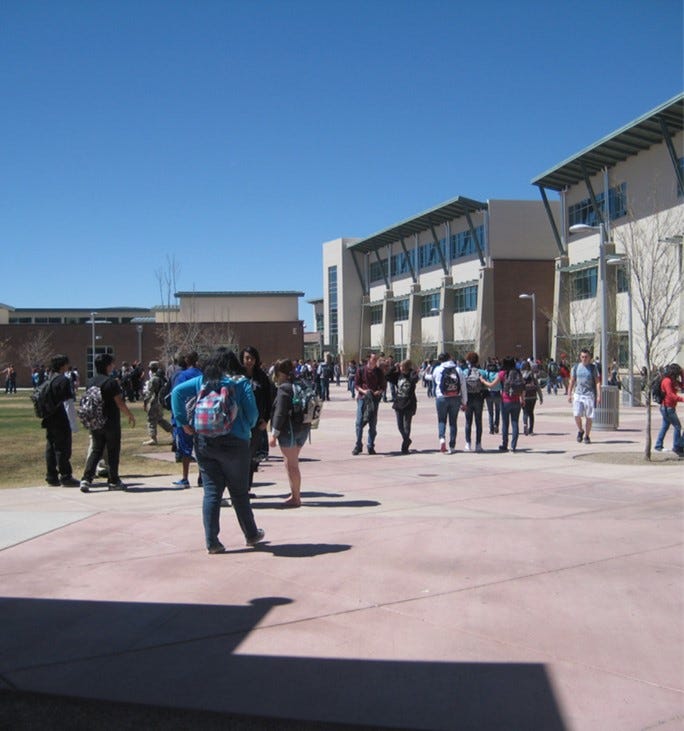
These nuances are important for understanding the nature of thermal comfort in middle and high schools, as I’ve discussed elsewhere. In one POE of a large New Mexico high school campus, we found that the variation between student and adult thermal comfort ratings was partially due to the greater variability in student clothing compared to adult clothing (particularly during the warmer months). One’s perspective of acceptable clothing is shaped by peers and family, school policy, and society in general. Clothing is also used as a means of establishing group identity as well as signaling membership within that group. For teenagers who are still maturing and experimenting with who they eventually want to be and what groups they want to belong to, clothing is part of that experimentation, both in terms of clothing type and the amount worn.

When a large segment of a facility population has a wide range of clothing styles subject to frequent changes, it becomes more difficult to align the physical and social environment’s capabilities with everyone’s thermal comfort needs. In addition, the students often had to traverse long distances between classes across campus, often outdoors as many of the buildings weren’t connected. Those individuals doing so were often warmer at the beginning of class as a result of their increased metabolic rates, even during the winter, compared to the teachers or their classmates who didn’t have to walk, or run, so far. It could take several or more minutes to cool off. The resulting thermal discomfort from not adequately accounting for the variability in clothing insulation values and metabolic rates was compounded by the fact that the majority of the other thermal comfort factors weren’t adequately accounted for during design either.
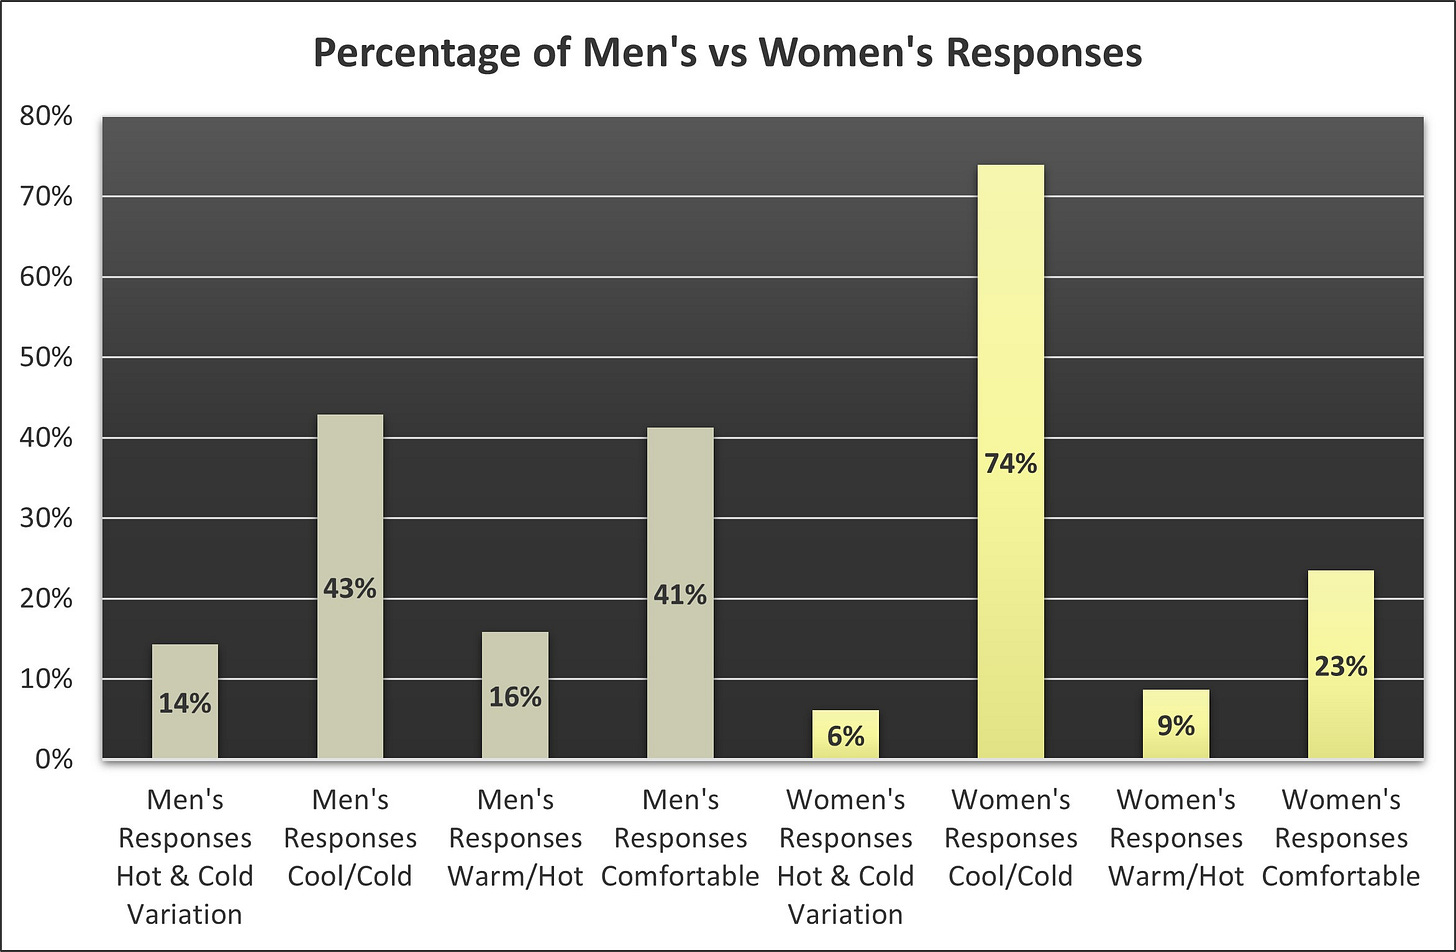
Turning to a different context, the figure below, summarizing the percentage of four different thermal comfort responses of men and women occupants, is from a 2009 retrocommissioning project of a federal courthouse. During systematic floor by floor interviews of occupants at their workstations, women reported being less comfortable than men, driven primarily by being cool to cold over the course of the year. While the differences between biological female and male physiologies (including variations that occur over the course of an individual’s life) can impact thermal comfort (one source), in this case, based on the interviews and observations, the primary driver for the percentage difference in cool/cold responses appeared to be differences in clothing layers.
Formal dress codes and cultural norms for a federal courthouse, circa 2009, generally resulted in lower clothing insulation values for the women (particularly over the lower part of the body). I now suspect that job type also played a role in this. More men, based on their roles (due to long standing issues of patriarchy and gender inequity) had private offices and a greater ability to control their temperature through thermostat access and opening/closing doors.

But while there was some variation in the thermal comfort responses between men and women, a Student’s t-Test (2 tail, type 3) run in Excel resulted in a p-value of 0.50, indicating that this variation wasn’t statistically significant. This suggests that the facility and it’s operations just weren’t up to the job of addressing the different thermal comfort factors for men AND women, even if the nature of that thermal discomfort varied somewhat between men and women and throughout the building. Not surprising for a 100+ year old facility that had undergone multiple renovations and additions over its life, never adequately taking all of our thermal comfort factors into account over that time.
When the physical environment is misaligned with our physiological phenotypic traits relative to thermal comfort, people will take actions to bring it into alignment - B = f(P, E) - to create an environment they’re more optimally adapted to. In this case that included contacting O&M staff daily (adding to their workload and stress), using personal space heaters and fans (increasing energy consumption and fire hazards), blocking vents/diffusers (reducing system efficiency and impacting the comfort of others) adding/removing clothing layers (including working in gloves/mittens which reduces individual productivity), and engaging in passive to active conflicts over thermostats controlling multiple rooms/areas (impacting working relationships and team dynamics). Such undesirable behaviors were a function of an environment incapable of adequately meeting thermal comfort needs.
Before moving on, I should note that in the above example the occupants did not self identify their gender or biological sex. These were assumed based on interactions during in-context interviews and observed clothing (following U.S. traditional binary male/female clothing norms). Biological sex was in turn assumed to match gender for the purposes of the analysis. Intentional or not, by erasing certain gender identities (as well as intersex individuals), this perpetuated aspects of gender and sexual discrimination. It also neglected phenotypic variation important for understanding the nature of thermal comfort in a building population. We continue working to be more inclusive and comprehensive in our assessments.
In both examples above, thermal discomfort arose ultimately because too few of the relevant thermal comfort factors were effectively accounted for. But what do we actually mean when we use the term thermal comfort, and what are the factors impacting it? According to ANSI/ASHRAE Standard 55, Thermal Environmental Conditions For Human Occupancy, thermal comfort is defined as that condition of mind that expresses satisfaction with the thermal environment and is assessed by subjective evaluation. Whether or not we subjectively consider ourselves thermally comfortable depends on an evolutionary shaped process that, per the ASHRAE Handbook - Fundamentals, hinges on whether or not body temperatures are held within narrow ranges, skin moisture is low, and the physiological effort of thermoregulation is minimized.

As Rodrigo Mora, Ph.D., P.E., and Robert Bean, R.E.T., P.L.(ENG.), put it:
The fundamental assumption is that the thermal sensation experienced by a person is a function of the physiological strain imposed by the environment [with the amount of strain proportional to the thermal imbalance from thermal neutrality]. However, the body is an adaptive system that adjusts its thermoregulatory responses (i.e., level of strain) for optimal homeostasis [regulating its temperature within a narrow band around 37°C (98.6°F)] as a function of a person's own conditions (activity level and clothing insulation) and the prevailing environmental conditions.
Whether or not the environment, which again is both physical and social, creates enough physiological strain to produce thermally uncomfortable sensations depends primarily on the interaction of six factors. Two of these that we’ve already discussed, metabolic rates as a result of occupant activity levels and clothing insulation values (determined by both clothing material type and the number of layers worn), are most directly tied to the people themselves. The other four are general physical environmental factors and consist of air temperature (dry bulb temperature), average air speed, mean radiant temperature, and relative humidity.
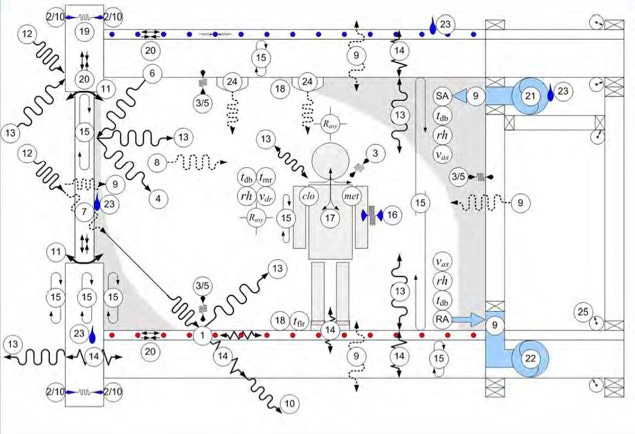
In reality, it’s more complicated than this, in that there are additional factors (vertical air temperature differences, radiant temperature asymmetry, floor temperature, and drafts) contributing to nonuniform conditions within a space and localized discomfort (see image below). While these localized factors will often be more important than the general environmental factors for any individual’s comfort at a specific time and location, to simplify the discussion for this post, I’ll be limiting the remainder of the thermal comfort discussion to the first six factors. See ANSI/ASHRAE Standard 55 for more detailed discussions of all of these factors.

Standards like the WELL Building Standard, with features requiring design meet ANSI/ASHRAE Standard 55 as well as validation of said performance, are helping push the industry in the right direction. But as Robert Bean has pointed out, we still have a ways to go. And that progress is further limited operationally with HVAC system controls driven primarily by air temperature and RH (not to mention the limited awareness and efforts made to account for relevant social/cultural factors, the influence of personal control, and the interactions with other IEQ states of mind). This is demonstrated by the results of a POE conducted within two of a U.S. university’s residential colleges (two complexes of residence hall facilities).
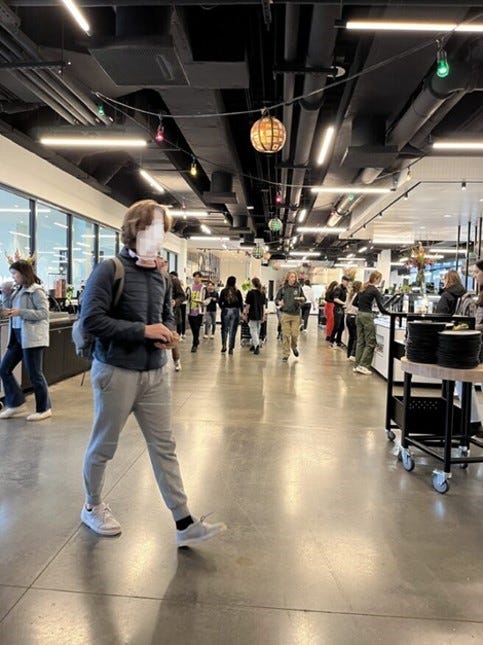
BranchPattern, along with three other consultants, in early 2024 completed a year-long effort working with a university’s facility department to develop a post occupancy evaluation process for said university and beta testing it on three of the their facility complexes. Two of these were a) a gothic residential college, consisting of 100+ year old facilities in some cases with significant portions, including residential dorm rooms and dining halls, lacking AC and b) a new residential college that was in it’s second school year of occupancy at the time of the evaluation.
In the graph below you can see that in 54% of the Gothic residential college (GRC) rooms measured and 23% of the rooms for the new residential college (NRC), the average air temperature measurements were NOT within the desired range as defined by the WELL Building Standard (feature T01, Part 1, Option 2). For relative humidity (RH), 62% of the GRC rooms measured and 38% of the NRC rooms did not meet the desired range as defined by the WELL Building Standard (feature T07, Part 1).
Turning to a more comprehensive assessment of thermal comfort, using the whole-body thermal-balance comfort (WBC) model (as referenced by ANSI/ASHRAE Standard 55) and CBE’s Thermal Comfort Tool, the predicted mean vote (PMV) was calculated for each of the different rooms assessed (called for by the WELL Building Standard feature T01, Part 1, Option 1). Each room’s PMV value was calculated using the operative temperature (determined from measured values of air temperature and mean radiant temperature), measured RH, estimated air speed, estimated metabolic rates, and estimated clothing levels (these estimates made more accurate as a result of the POE’s ethnographic work).
We determined that the PMV values did NOT fall within -0.5 to 0.5 for 58% of the GRC rooms assessed and 60% of the NRC rooms, though it’s important to note that the NRC rooms out of compliance were much closer to passing than the out of compliance GRC rooms. Nevertheless, for NRC, the PMV results weren’t in alignment with the air temperature and relative humidity measurements themselves.

This demonstrates how looking at only one or two thermal comfort indicators (typically air temperature and RH) doesn't provide the full picture. Focusing solely or primarily on those two will result in thermally uncomfortable buildings. Using the WBC model, we can also estimate the percentage people dissatisfied (PPD) for each room’s environmental conditions and the related sensations experienced. These are the last factor in the graph above (the 27% dissatisfied for GRC and 15% for NRC) and the first row in the table at the bottom of the graph – with the sensations of discomfort being mostly on the slightly cool to cold side for most of the rooms.
We can then compare these modeled outputs to the survey responses - the fourth factor in the graph – 38% dissatisfied for GRC and 12% for NRC. Note that while NRC’s modeled and surveyed percent dissatisfied values are close, the survey dissatisfied responses for GRC are 11% more than the modeled value. There are a couple of things to note for understanding this difference. First, survey responses for IEQ satisfaction are influenced by conscious and subconscious perceptions and are typically biased by the most extreme conditions occupants have experienced within the building.
Second, the modeling here reflects the November fieldwork conditions, but the survey responses were significantly influenced by the building conditions during warmer months, particularly for GRC. This is demonstrated by looking at the survey sensations, the second row in the table, with the discomfort responses being mainly on the warm to hot side (especially for GRC). This differs from the modeled sensations that were mainly on the cool to cold side (reflective of November conditions). The percent dissatisfied in NRC is likely more consistent over the whole year (more likely complying with ASHRAE’s target of no more than 20% of occupants experiencing thermal discomfort), but GRC’s is likely much higher during the warmer months (and too high year-round), driven mostly by building age and condition, envelope performance, and a lack of AC.

This demonstrates that to validate thermal comfort, and sufficiently account for all of the factors that shape it, we need a combination of measurements, surveys, and in-context interviews and observations. And with increasing research (some listed below) demonstrating links between high air temperatures (including those experienced in dorm rooms overnight) and negative impacts on cognitive function and learning, it becomes crucial to align our built environment’s capabilities with our evolutionarily shaped thermal comfort needs in general as well as address the inequities that exist across buildings like those presented here.
Policy and behavioral consequences (B = f(P, E)) resulting from GRC’s extremes during the warmer months included the university issuing fans to every student for their dorm rooms, students finding other places to sleep during the warmer months (typically with friends in other dorms, apartments, etc.), and avoiding the dining hall during the warmer months (increasing the crowding of other campus dining halls). Dining hall staff, however, obviously did not have this choice.
Selected Research
Next time we’ll dig into aspects of thermal alliesthesia, biophilia, and indoor air quality (IAQ) relative to evolutionary mismatches and the evolutionary dual nature of our built environments. The importance of our evolutionary history in shaping our thermal sensations and perceptions of thermal comfort in general will also be addressed in more detail during the next article.


